OpenStack Horizon: extending the dashboard – Part 2
In this second installment of my blog on OpenStack Horizon, I will take you through different source code files that make a custom OpenStack dashboard. As a recap from the first installment, I will show you how to create a custom dashboard to view all the Neutron “ports” in your OpenStack based cloud.
Enabling OpenStack Horizon Dashboard
Django framework loads and enables dashboards based on entries present in the enabled directory of OpenStack Dashboard. This is typically located under /usr/share/openstack-dashboard/openstack_dashboard/enabed/ folder of your OpenStack Horizon installation.
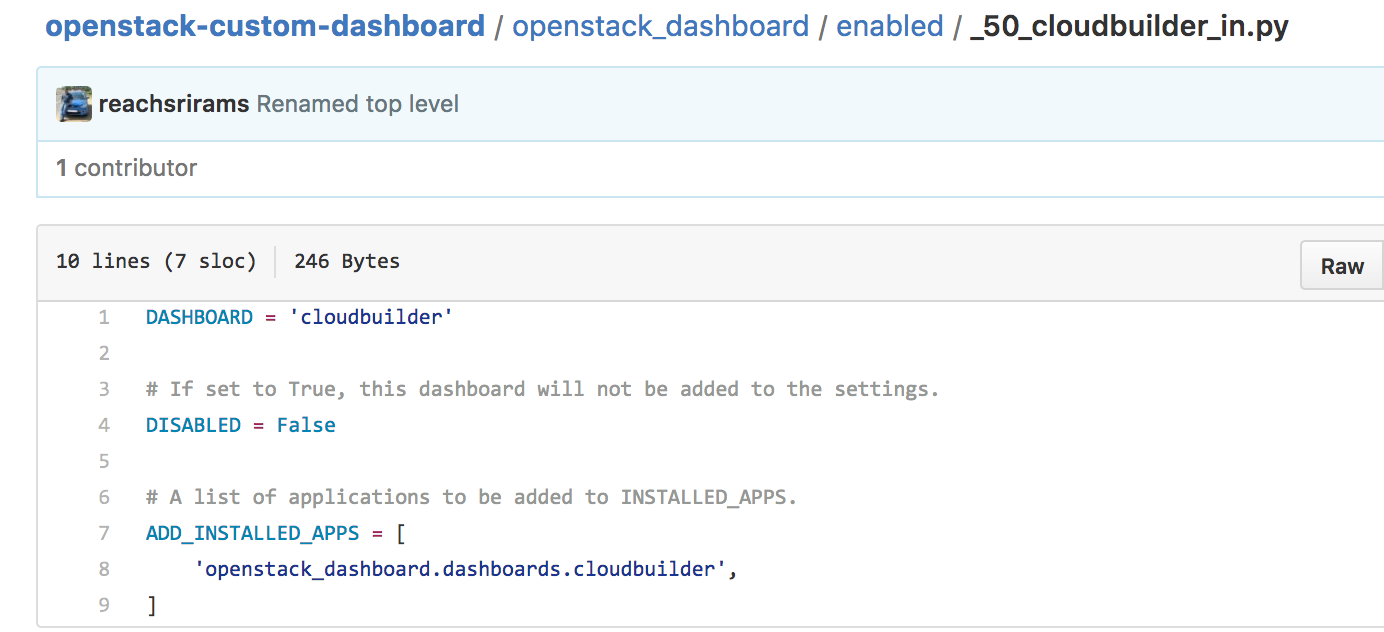
Python file to enable a OpenStack Horizon dashboard
As shown above this Python file defines a Dashboard called cloudbuilder and the DISABLED flag is set to False. Django will look for a Python package called cloudbuilder to construct and display a custom dashboard. In this package, Django will look for a file called dashboard.py to load the actual implementation of the dashboard.
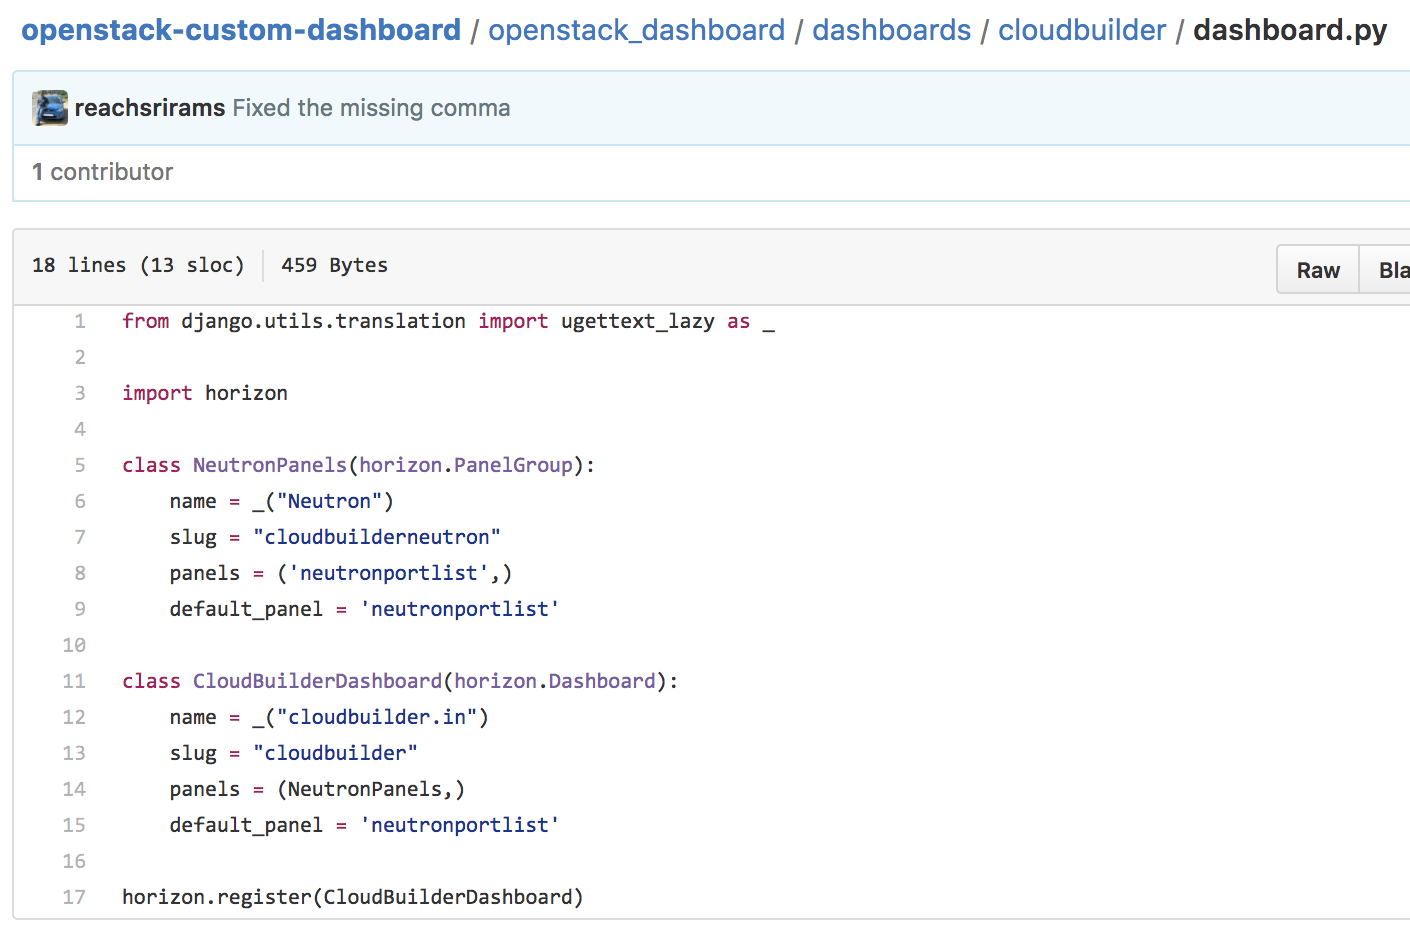
Python file containing dashboard implementation
As shown above the dashboard.py defines a class CloudBuilderDashboard that extends the default horizon.Dashboard class. The slug used to give a unique URL for the dashboard. We further define the list of Panel Groups for this Dashboard. The definition of Panel group called NeutronPanels shows that it will contain one Panel called neutronportlist.
OpenStack Dashboard Panel
We have shown that Panel Group contains one or more panels and in the code snippet above neutronportlist is one of the panel in our example. Once again the Horizon Django framework looks for a Python package named neutronportlist in order load the panel. This is the package that will contain the Django MVC code that we discussed in the first installment of this blog.
Let us first look at the panel.py file. This file registers the panel with Dashboard so that it can be shown as part of the overall Horizon dashboard. Once again the slug represents the URL that will be used to display the panel on the web broweser.
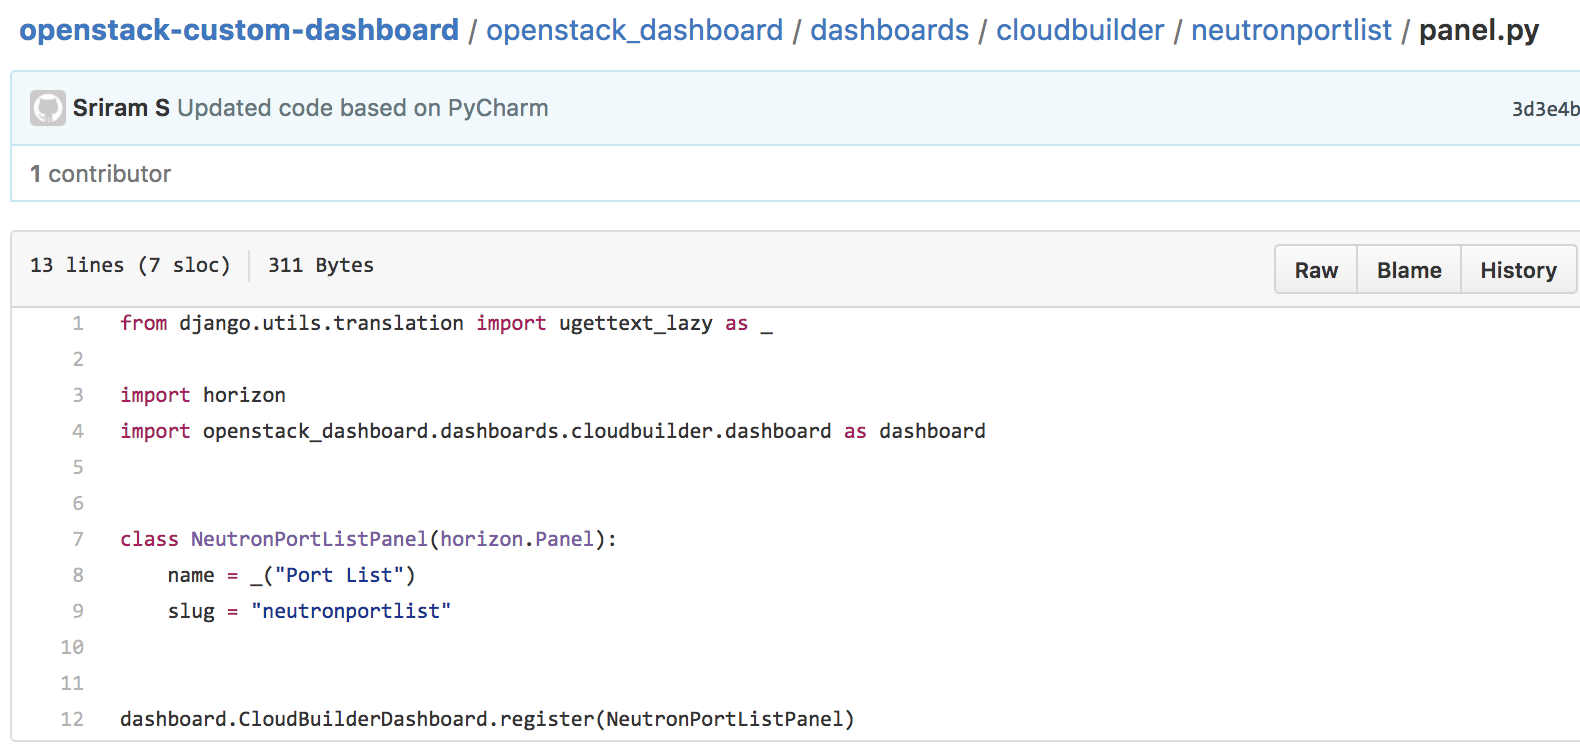
Registering a panel with a Dashboard
Now we will turn our attention to the most important file within the entire custom dashboard code. This is the views.py file for a given panel. As discussed in the previous installment, the views.py represents the controller of the panel. Therefore it plays a central role in what is finally shown to the end user.
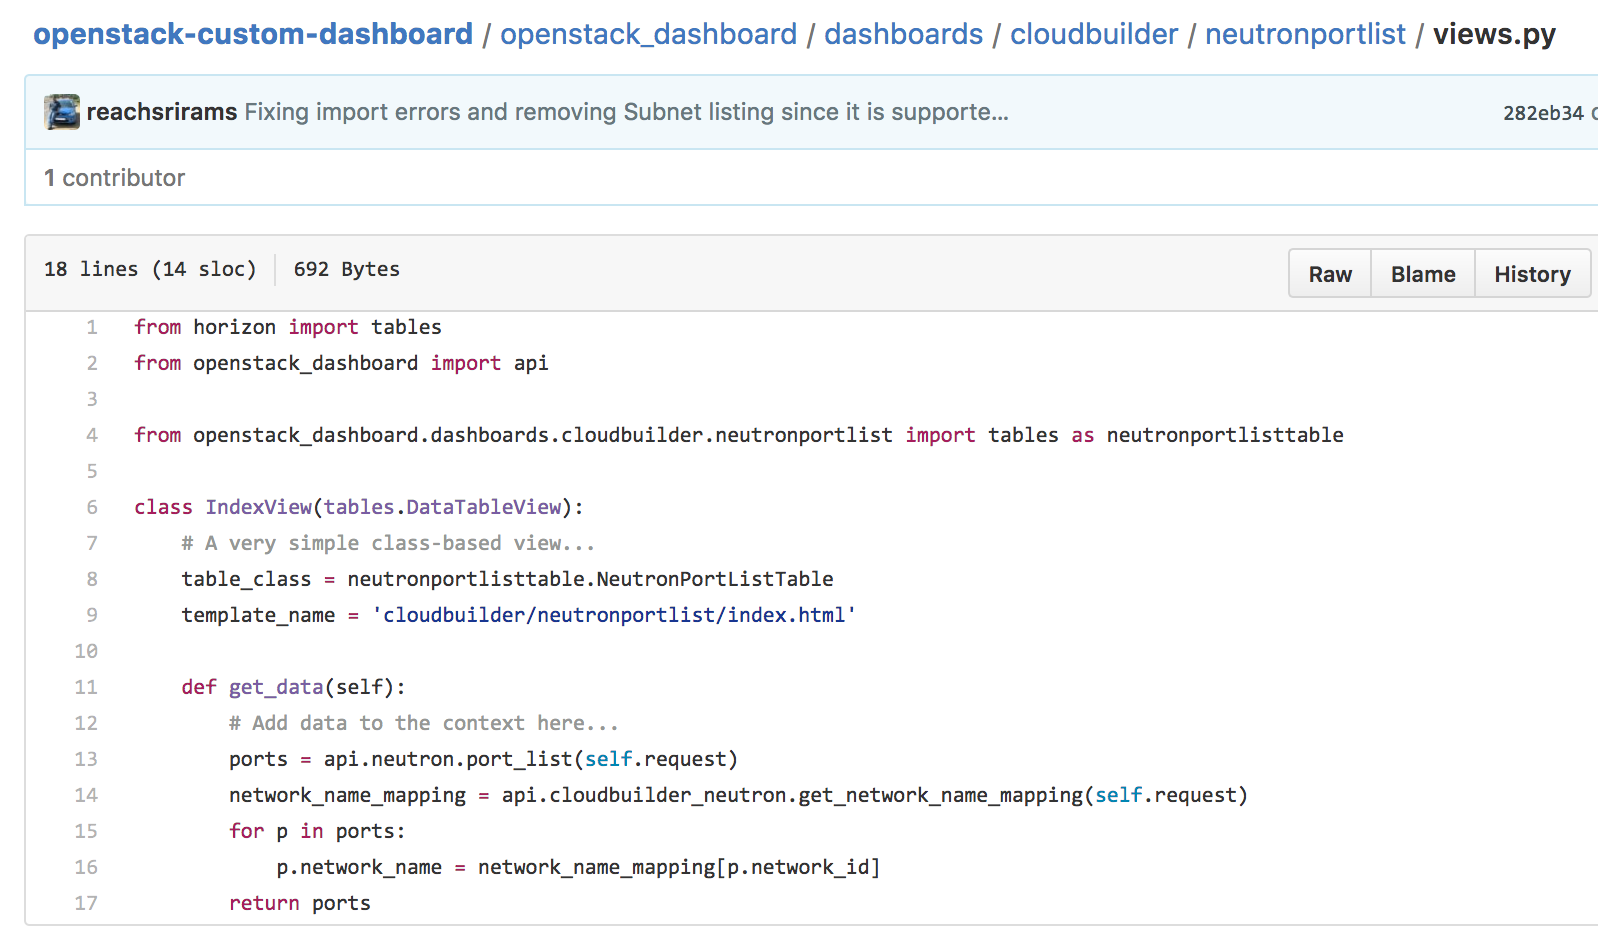
Neutron Port List Panel
The above code snippet shows the views.py of the Neutron Port List Panel. This file represents the Controller in the MVC pattern and as you can see from the code the Model is represented by table_class variable and the View is represented by the _template_name _variable. In addition, the Controller decides how to fetch the data that will be displayed in this page. Since we are showing a list of all Neutron ports the _get_data _method is using the Neutron API of Horizon to fetch the list of ports.
The last file related to this custom dashboard is the tables.py. This file represents the model for the Django application. We have shown that the controller (views.py) retrieves the data but the UI will use the tables.py as the model to process and data.
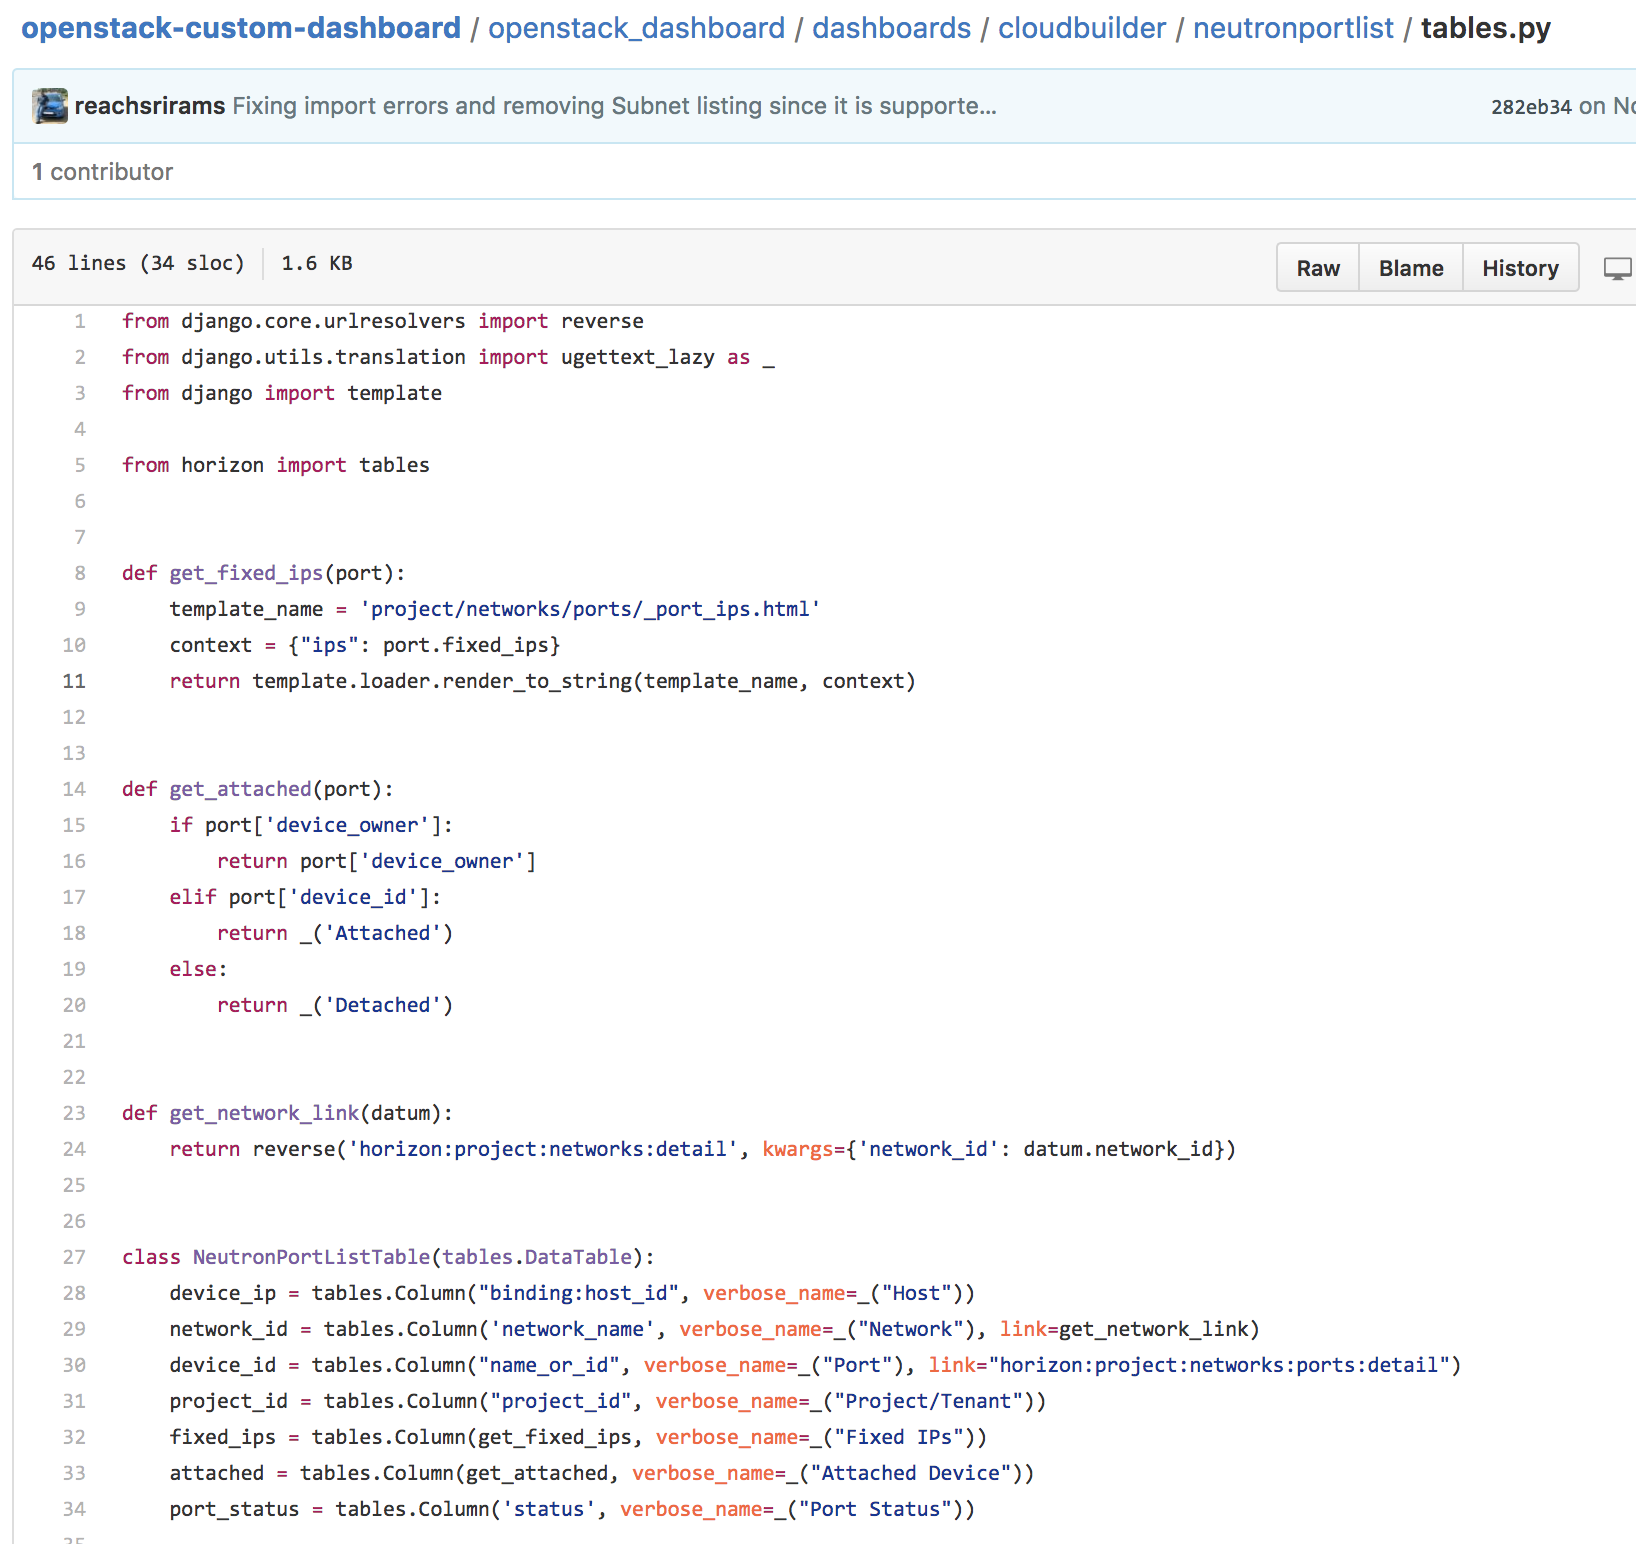
Code representing the Model
A quick look at the tables.py shows that it defines the columns and the corresponding values from _port _that will be displayed on the UI. You can use this file to customize what gets displayed on the Web page. For example: if port has a non-empty Device ID, then it means that it is attached to some network resource. This is displayed as “Attached” as per the snippet shown above.
The final piece of the MVC pattern used in a OpenStack Horizon dashboard is the UI. This is represented by the index.html in the templates package of the panel. In our case we can see below that the Django framework will simply render the table while processing the directives inside index.html.
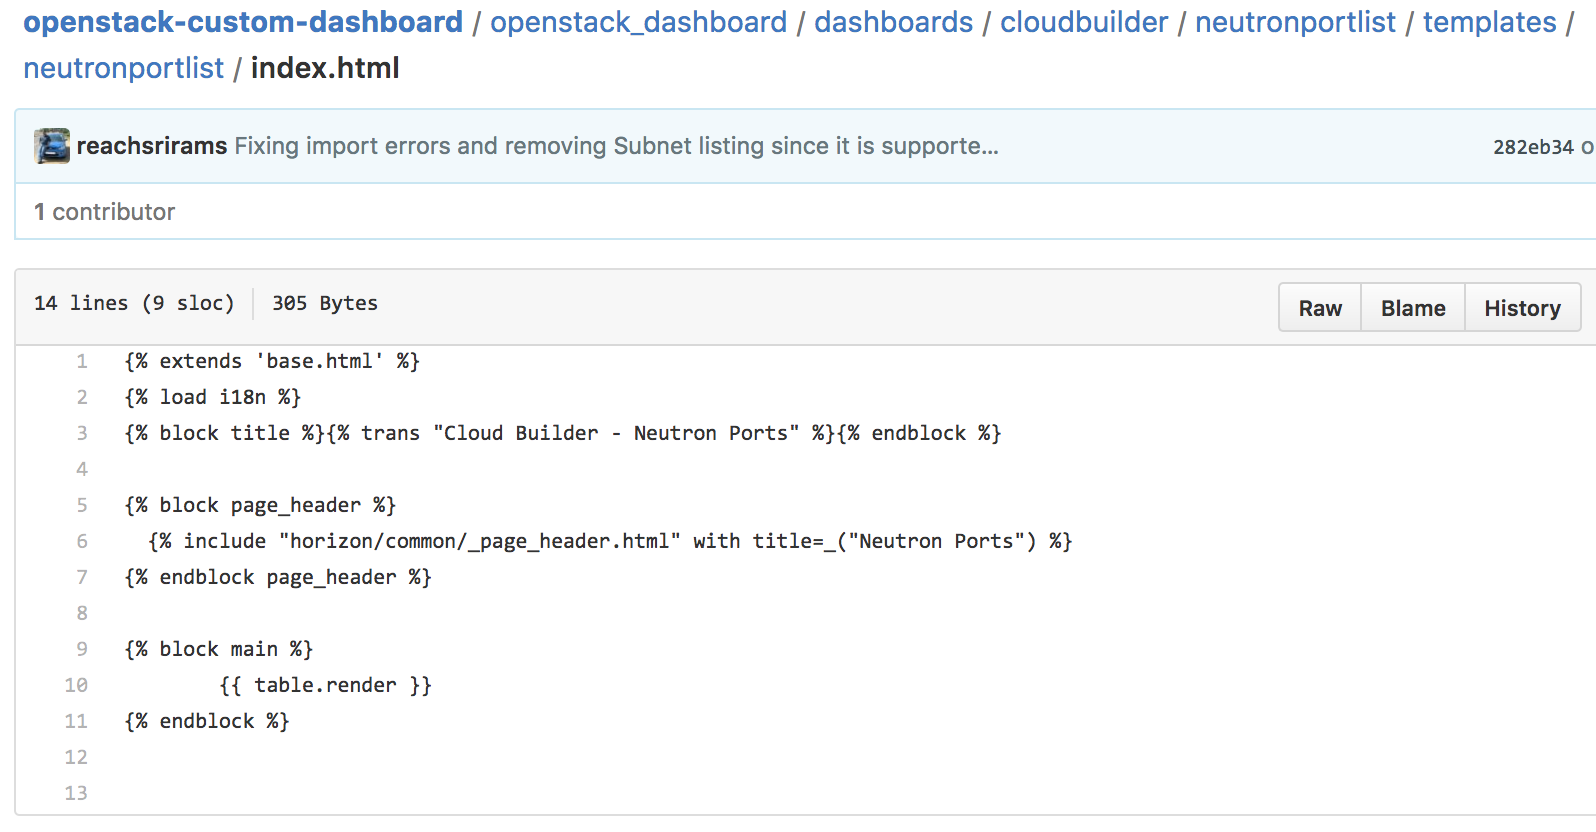
The view component of the dashboard panel
Putting it all together
We have seen all the important files that make up a custom OpenStack dashboard. The source code for this blog is available on GitHub. It also includes a script to install these files in appropriate locations of your OpenStack installation. Please check install.sh to ensure that the locations match your installation. Once the files are installed, you need to restart the Apache service using sudo service apache2 restart. You can then login into your Horizon UI and check if the new custom dashboard is seen or not.
Here is the screenshot of how the dashboard looks on my OpenStack setup.
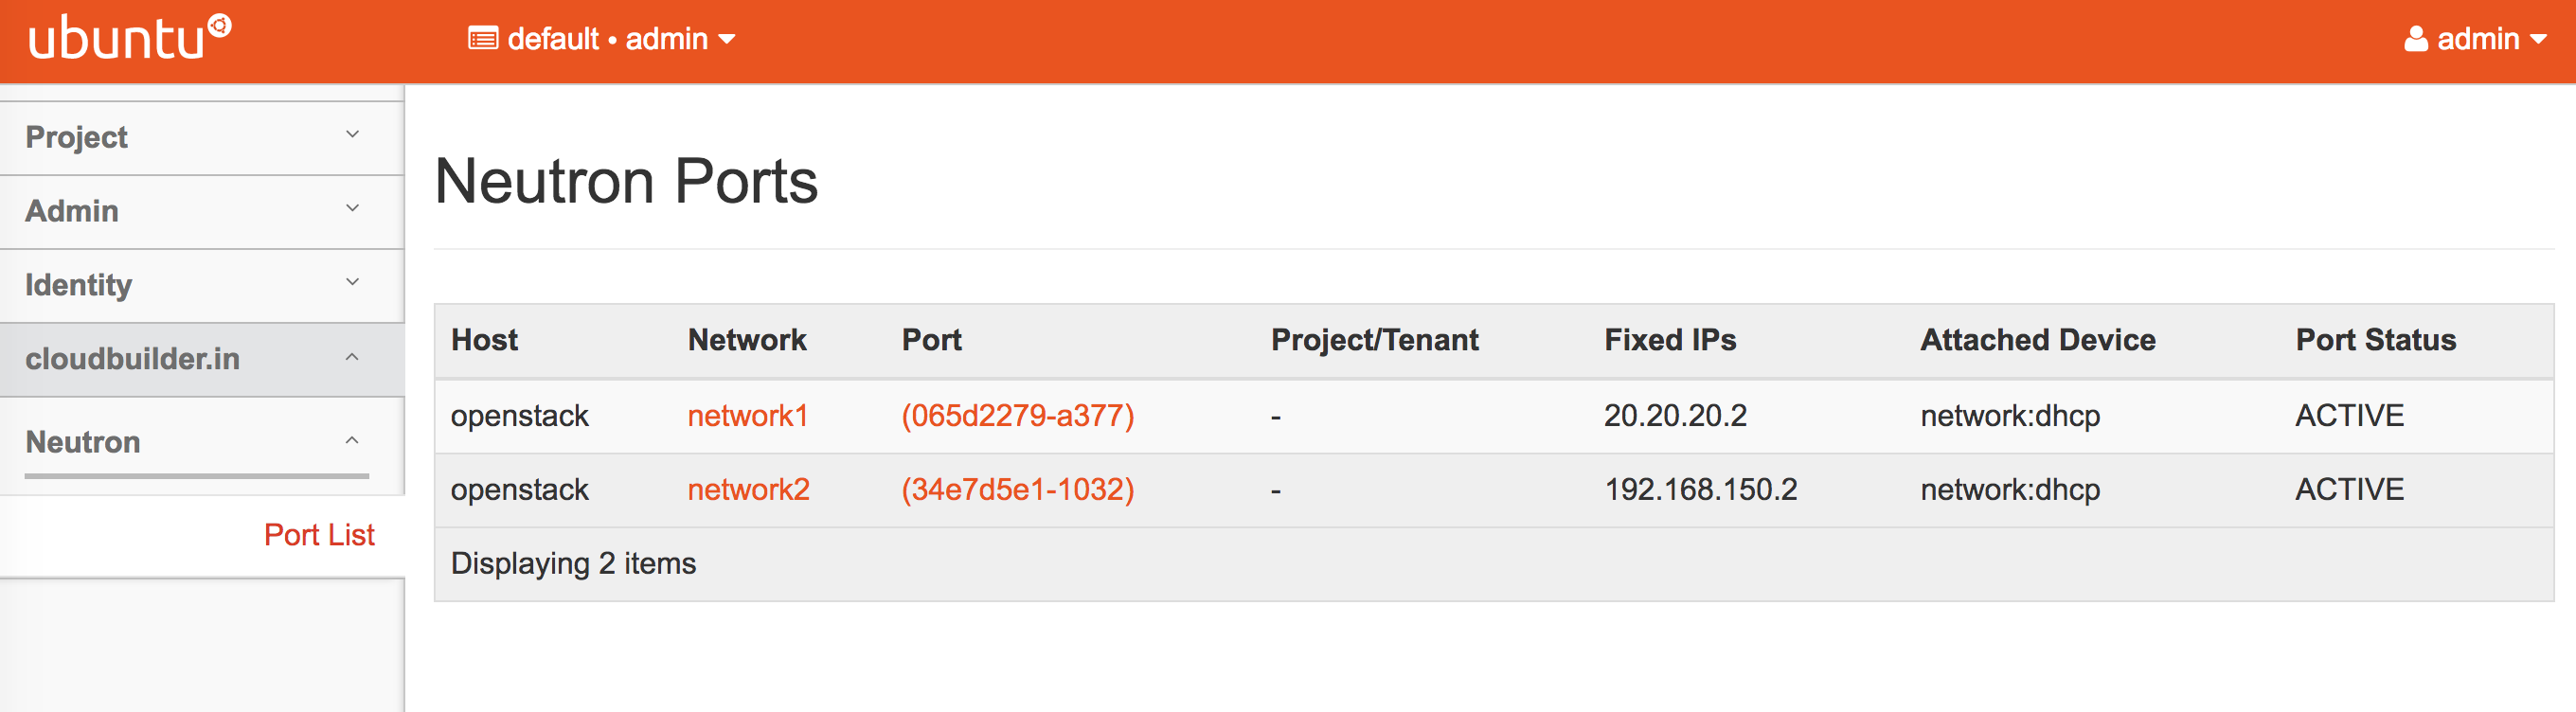
How the dashboard looks
This completes my introduction to the source code involved in creating custom dashboards and panels in OpenStack Horizon.